


Global warming - it's getting hot in here
Global temperature has risen by 0.74 degrees C from 1905 - 2005, Arctic sea ice has been shrinking by 2.7% per decade since 1978 - a reduction of millions of square kilometres of ice cover, the sea level has risen by around 150mm since the 1900's and is still rising and faster than before.(1)(2)
Global warming is no longer just a possibility: it is here staring us in the face, a stark reality. This warming is at least partly due to us (2).
The increase in CO2 is mainly due to excessive fossil fuel use - oil, coal, gas. Atmospheric carbon dioxide (CO2) and methane (CH4) concentrations now far exceed the natural range seen over the last 65,000 years. The global increase in CO2 is primarily due to the use of fossil fuels. The increase in methane is very likely due to agriculture (2).
Greenhouse gas emissions from human activities increased by 70% between 1970 and 2000. CO2 is the most significant greenhouse gas and CO2 emissions grew by around 80% between 1970 and 2000.(2)
It should be pointed out that the climate of the earth is not a constant thing and that it has very much changed over time. We have in fact seen much bigger climate changes within the last ten thousand years than are being predicted at the moment. The climate will change in the future, and factors other than greenhouse gases will be the cause. However greenhouse gas emissions will have their effect too and if we can buy ourselves a few more thousand years of more or less stable climate and reduce energy and materials consumption at the same time all the better.....
Don't you think that the weather's a bit odd?
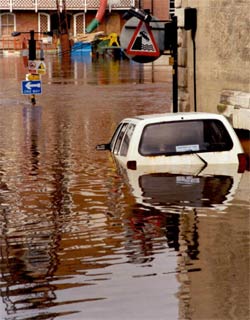
Flooding in the UK. Pictures (1)
Over the last 50 years it is more than 90% certain that, on land, there have generally been been less cold days, cold nights and frosts, while there have been more hot days and more hot nights. It is likely that there have been more heat waves, more heavy rainfall events, whilst the areas affect by drought have increased (1)(2).
In the UK the autumn of 2000 was declared the wettest since records began in 1766 (3).
The earlier timing of spring events are happening earlier, and the shift in the ranges of animals and plants are with very high confidence linked to global warming. (4)
It's going to get worse unless we do something
If we carry on as we are (with the current CO2 emission reduction policies and initiatives in place) then global emissions will continue to rise which will very likely mean we will see larger climate changes to come (5).
One of the predicted scenarios for temperature increase by 2090-2099 (relative to temperatures in 1980-1999).(2)
Which people make the most greenhouse gases?
The USA - you will see from the graph below that in terms of emissions per capita that the USA leads the way, with other developed groups of countries following behind. No wonder they keep edging out of any binding agreements.
CO2 emissions per capita - Pictures (3)
So what can the world do about it?
Appropriately charging for greenhouse gases is a very simple answer - everything else will be driven by this. The creation of an international carbon market (which would probably mean an international carbon tax and carbon trading scheme) could drive significant CO2 reduction across the board (6)(7).
60-80% of the reductions in greenhouse gas emissions would come from change in energy supply and use and changes to industrial processes. Energy efficiency would also play a key role (8)
So what can you do about it?

There are a lot of easy things you can do to reduce your greenhouse gas emissions. Please see our greenhouse gas reduction tips page.
 Read about ways in which we are trying to make Stovesonline a more sustainable business.
References:
1.The IPCC AR4 synthesis report: summary for policy makers. Page 1 (1.1, 1.2).
2.The IPCC AR4 synthesis report: summary for policy makers. Page 2 (1.2)
3.The Met Office: http://www.metoffice.gov.uk/corporate/pressoffice/anniversary/flood2000.html
4.The IPCC AR4 synthesis report: summary for policy makers. Page 6 (3.1).
5.The IPCC AR4 synthesis report: summary for policy makers. Page 4 (2.2)
6.The IPCC AR4 synthesis report: summary for policy makers. Page 19 (4.5)
7.The IPCC AR4 synthesis report: summary for policy makers. Page 18 (4.3)
8.The IPCC AR4 synthesis report: summary for policy makers. Page 22 (5.5)
The IPCC AR4 synthesis report: summary for policy makers and the IPCC Mitigation of climate change report: summary for policy makers are both available from http://www.ipcc.ch
Pictures and figures:
1.Flooding in the UK picture courtesy of the Environment Agency.
2.The IPCC Mitigation of climate change report: summary for policy makers. Page 9, figure SPM 6.
2.The IPCC Mitigation of climate change report: summary for policy makers. Page 5, figure SPM 3a.